Using Analytics to Find Actionable Data
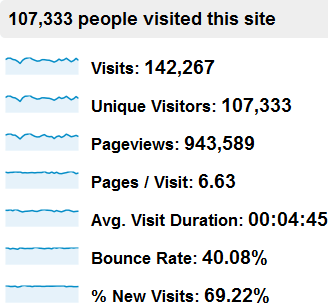
Pageviews don't make a site successful, but it's usually the first thing you see when you look at an analytics dashboard.
 These stats are displayed so prominently that it's easy to think that they're key performance indicators (KPIs), and many companies treat them as such. The problem is that these aren't true KPIs; They're vanity metrics.
What are vanity metrics?
Vanity metrics are metrics whose changes don't directly correlate to increased conversions. While they might look pretty, they're only important in that they are the core building blocks for the data you really want to be analyzing. If you focus on vanity metrics, you cannot answer the questions you need to answer to make sure your site is healthy.
Why are vanity metrics dangerous to use as performance indicators?
Suppose I told you that my eCommerce storefront had 5% more unique visitors last month. At a very high level, that sounds great. Now, suppose I told you that revenue dropped 2% last month. Suddenly, it doesn't sound so good. Why am I making less money with more users?
Even focusing on overall revenue is dangerous. Suppose I said my storefront was making 5% more money. Cause for celebration? Not if I had 50% more new users during that period. Why did so many more new users result in such a low increase in revenue?
Each of these scenarios create more questions than answers. However, it's easy to dig past these vanity metrics and answer those questions with actionable metrics.
What are actionable metrics?
Actionable metrics answer specific questions about the performance of a site:
- Am I making money on my marketing efforts?
- Where are visitors dropping off before they convert?
- Is there something I can do to make fewer users drop off?
- What is likely to cause users to convert at a higher rate?
Note that these questions all focus not just on raw numbers, but attempt to get answers that can result in direct action to improve the site.
In my previous example, I mentioned a site that saw 50% more new visitors but only 5% increased revenue. To figure out why, a good step would be to see how those users progressed through the purchase funnel.

Now, the problem in the example is a bit more clear. The ad landing page had a lot of traffic that never got to the product page. The product page was pretty successful in that most people added the product to the cart, but most of those people didn't follow through with the purchase. Armed with this kind of information, it's easy to identify part of the site that should be considered for split-testing. With some tweaks, it's possible to reduce the friction of this funnel and end up with more sales.
You'll have to dig deeper for actionable metrics than you do for vanity metrics, but it's worth it. Fortunately, most modern web analytics solutions provide standard reports that help discover many common actionable metrics pretty quickly. For information that's specific to your organization, you can also create custom reports that you can refer back to for tracking the progress of important actionable metrics.

If you liked this article, you may want to: